I write long-form posts on LinkedIn—ones with long sentences, shorter lines, and lots of conjunctions. There’s a rhythm to it, and it’s fun to write, and always fun for me to read. I wanted to visualize all of it somehow.
There’s a famous quote by Gary Provost about writing music, and I think about it whenever I write. But till now, I haven’t come across any tools that measure that ‘musicality.’ The Hemingway app helps with reading ease and complexity, and I’m sure Grammarly tracks some measure of ‘writing rhythm’ in the background, but neither tool publicly exposes or displays what I’m looking for.
So I decided to build my own. I call it LineViz (for ‘line visualization’).
One of my own LinkedIn posts. It measured a 0.72 rhythm score (normalized between 0 and 1), a flow index of 52 (average characters per line), a relatively high Flesch Reading Score of 86, and relatively high entropy (0.85 normalized, with 2.55 bits required).
LineViz: What and why
LineViz is a small browser tool that takes in text and displays it graphically. It focuses on character counts instead of words (to help us get granular) and tries to measure a few metrics at once: flow index, rhythm score, reading ease (Flesch), and a metric I call length entropy. More on these in a bit.
At this time, LineViz is most useful as an editorial tool to spot formulaic writing. It can help improve writing structure, as you think differently about structure and pacing after seeing your writing graphed and quantified.
Architecture, limitations, and issues
I first generated a single-file HTML prototype, but later split it into HTML, CSS, and JS. This made it easier to read and debug. I then added a histogram using Canvas, with PNG export. The histogram uses 20-character bins for comparison across runs, and there’s an option to ignore spaces.
LineViz isn’t perfect: its sentence splitting heuristic may mishandle edge cases, and it only approximates syllable counting. And since you can often say more with fewer words, using character count might ignore semantic density.
I also didn’t validate any engagement correlation (i.e., whether posts that scored well on my metrics performed well on LinkedIn) for two reasons: the test sample size was tiny (about a dozen posts), and I care less about likes and more about depth, resonance, and reading enjoyment. I’m certainly biased.
At some point, there was a small issue with the tooltips: they would reflow text and push the layout up. I fixed this with absolute positioning.
Measured metrics
LineViz measures 4 metrics: flow index, rhythm score, reading ease, and length entropy.
Flow index is the average sentence length in characters per line. I use it as a proxy for depth and sentence development. Low values correlate with fragment-heavy writing (the type all the LinkedIn gurus use), while moderate to high values correlate roughly with more developed prose.
Rhythm score here is the coefficient of variation (CV), calculated by dividing the standard deviation of sentence length by the average. We use CV to measure structural variability, with low values indicating uniform pacing, while higher values indicate altering more dynamically between long and short sentences.
Flesch reading ease (FRE) is a well-known metric; I include it here mainly for reference. It works by calculating sentence length and estimating syllables per word, with fewer syllables equating to ‘easier’ reading and more syllables seen as ‘harder’ to read. It was not strongly predictive of post quality in the limited dataset I used; more testing might be needed.
Length entropy is calculated using Shannon entropy (great analogies here) over fixed-width sentence-length bins. It measures how evenly sentence lengths are distributed across bins. The value is normalized between 0 and 1 by dividing by log₂(k), where k is the number of occupied bins. Higher values indicate more even distribution. In our observations, extremely high normalized entropy (0.95+) with fewer bits can correlate with structurally engineered text (read: AI), though this is a heuristic, not a formal classifier.
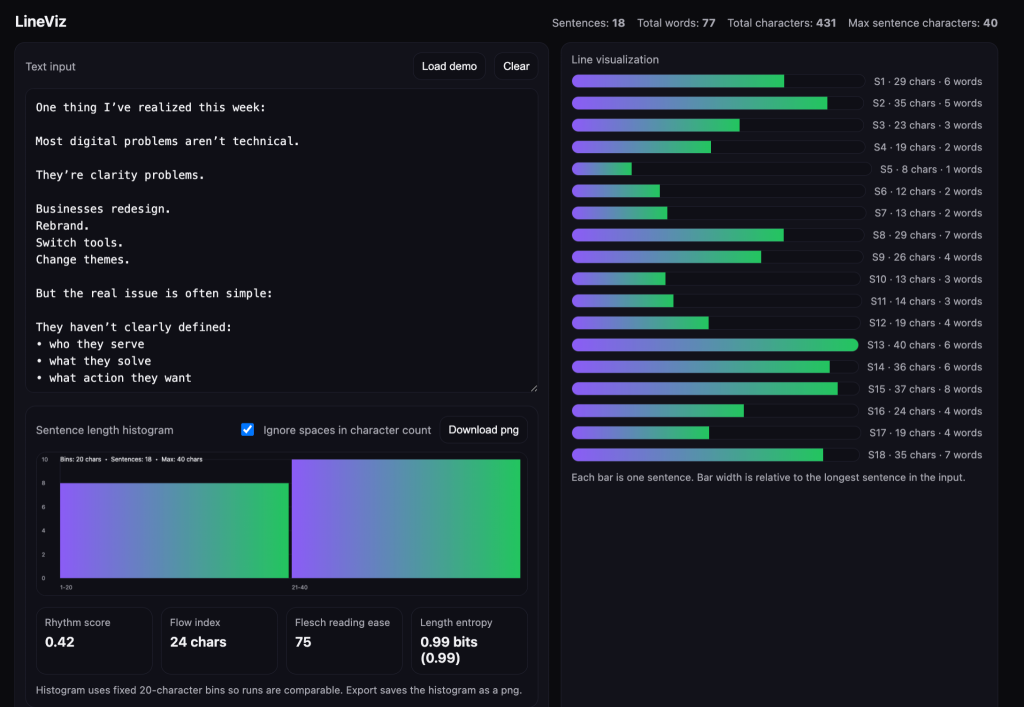
A LinkedIn post with a low number of bits (less than 1), high entropy. Mid to low rhythm score, low flow index, and high reading ease. This type of content may not be particularly enjoyable to read, but may perform well on social media platforms that reward easily digestible takes.
Tests, findings, and implications
I gathered a bunch of posts I’d like to emulate going forward (including some of my own), and labelled these as the positive set. I then gathered a negative set of posts I wouldn’t want to see or write. The negative set included stuff you’ve probably seen on your LinkedIn feed: fragmented, formulaic, low-engagement broetry. I ran both sets through LineViz and compared the metrics.
In the positive examples, I observed the following:
- Flow index: 50-70 characters
- Rhythm score: 0.50 – 0.75
- Length entropy: 0.85 – 0.96
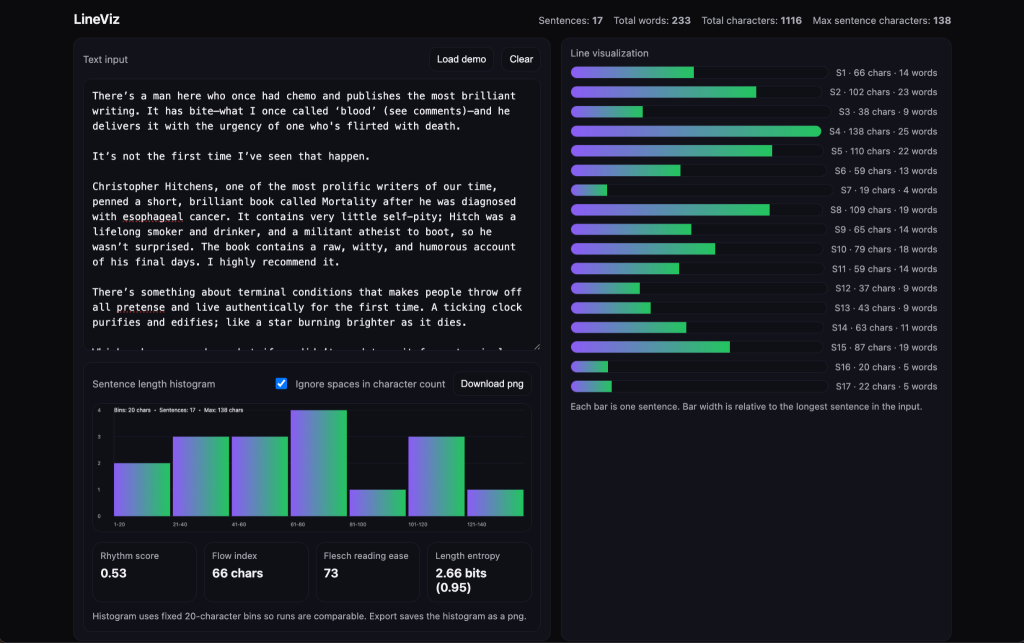
One of my own LinkedIn posts. It’s got a mid-level rhythm score, an upper middle flow index, a Flesch Reading Score of 73, and high entropy with close to three bits needed to convey information.
In the negative set, I’d observe high entropy despite shallow depth. The structural profile resembled ‘stacked fragments’ instead of developed arguments:
- Flow index: < 40 characters
- Rhythm score: < 0.45
- Length entropy: 0.91 – 0.99 (maximally high — likely due to the way AI tools are designed)
Looking over both sets, it appears that the flow index (higher is better), rhythm score (mid-to-higher is better), and length entropy (More bits and a higher score is better), most reliably separate strong from weak writing. Flesh readability score was a weak discriminator in my dataset.
Based on the early findings, engaging writing (the way I define it: rich, dense, nutritious) usually balances expansion and contraction – which makes sense intuitively. Developed ideas require longer sentences, while shorter sentences can help with emphasis, or function as resets and palate cleansers. Over-fragmentation reduces perceived depth (and gets monotonous quickly), while overly-high or perfectly even distribution (entropy) may signal artificial tuning. It’s probably why AI-written text is so recognizable.
Of course, none of this ultimately matters: I’ve seen ‘weak’ writing go viral, and ‘strong’ writing languish in the feed. A bigger account engaging with your content (or you being big yourself) might matter more to your content’s success than writing like Chuck Palahniuk or Richard Feynman.
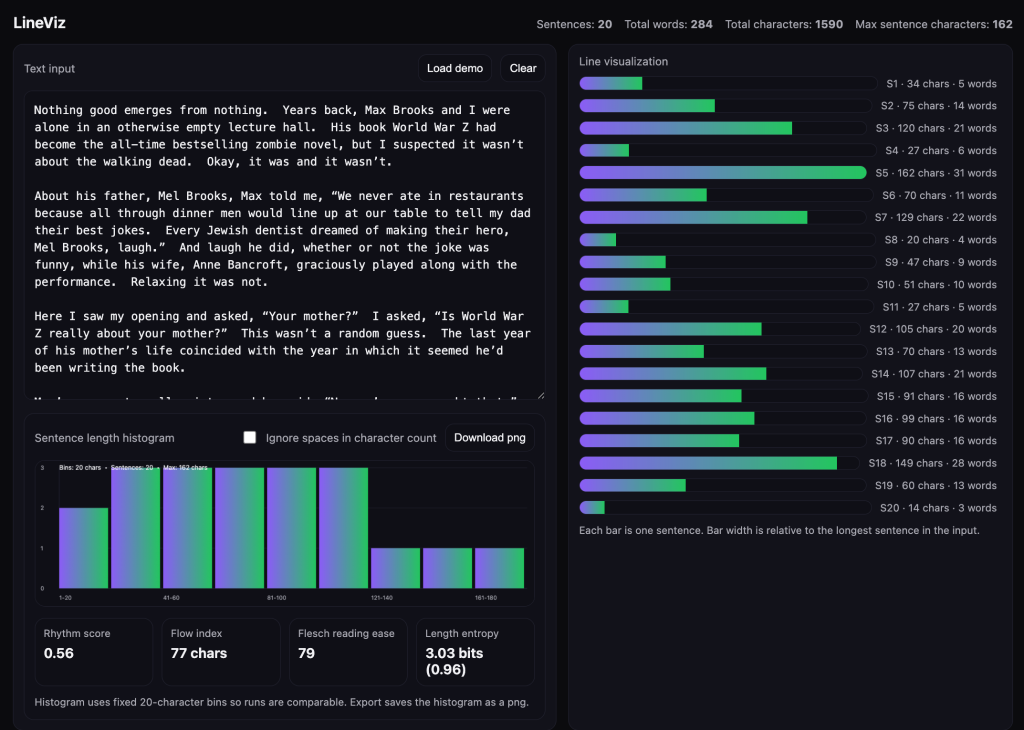
A snippet from Chuck Palahniuk’s writing, featuring a mid-level rhythm score, a flow index of 77, an FRE score of 79, and a relatively high entropy + bits required.
Probably the biggest takeaway is to simply write stuff yourself and rely less on AI. Writing is a forcing function that helps you think more clearly, and the process tends to produce more rhythmic writing that’s easier to read (because you’re writing for your ears, too). Plus, it’s good practice.
I can think of a few LinkedIn content tools that could benefit from integrating a feature like this, as their output tends to be formulaic and unoriginal. Having a way to generate dynamic content in someone’s voice would provide better value. But therein lies the irony: the best way to write something interesting in your own voice is for you to do the writing. AI can only go so far.
